Are the Nordics still leading sustainability in Europe?

With the introduction of the CSRD, ESRS, and the EU Taxonomy, sustainability performance is increasingly assessed through measurable indicators, particularly data availability, consistency, and comparability.
Using Position Green benchmark data from last year, let’s examine how Nordic companies perform across a set of sustainability indicators compared with other regions.
Data scope and sample definition
A small note before we dive in. This analysis is based on Position Green benchmark data covering approximately 350 companies active on the platform during 2024 and early 2025.
Some indicators draw on a slightly larger sample of up to approximately 400 companies where partial disclosures are included. As a result, not all metrics rely on an identical population. Regional comparisons in this article are based on indicators where consistent filtering is applied to ensure comparability.
Where the Nordics perform strongly
Renewable electricity consumption
Nordic companies report a relatively high share of renewable electricity as a proportion of total energy consumption compared with most other regions.
Position Green benchmark data shows that average renewable electricity consumption is approximately 50 percent in Sweden, 45 percent in Norway, and 43 percent in both Denmark and Finland.
At a regional level, the Nordics report higher average renewable electricity consumption than the United States and the rest of the world, while results are broadly comparable with other European regions, where the rest of the EU averages around 42 percent.
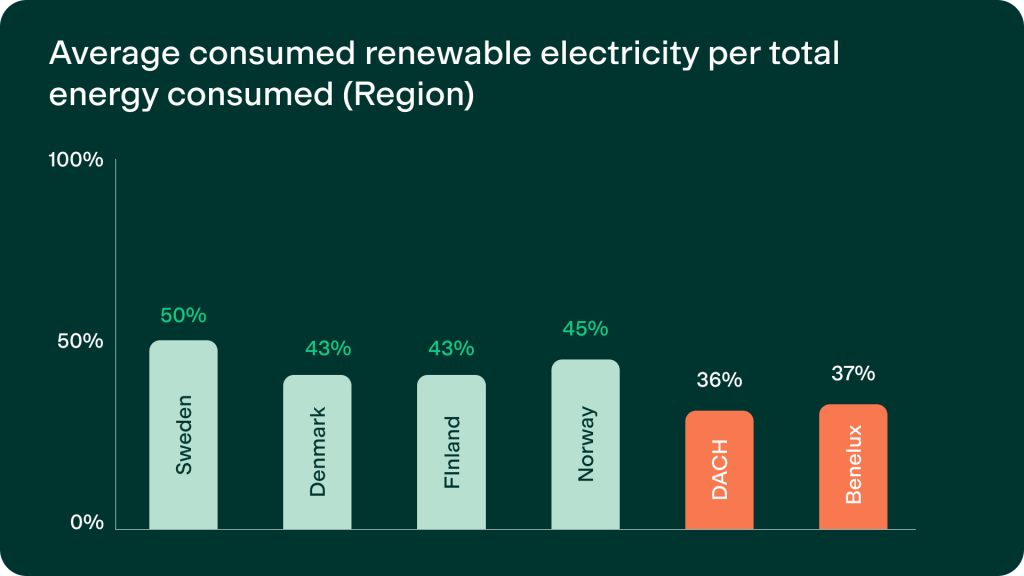
With a mixed bag like this, it is interesting to see that Sweden leads so definitively in its green energy consumption, but that overall the Nordics are still ahead of the curve in this regard. It should be noted that as more regions increase access to renewable electricity, leadership on this metric alone is unlikely to define future sustainability performance, particularly when value-chain emissions dominate overall impact.
Board gender diversity
Nordic companies report moderately on board gender diversity, though performance varies significantly across countries and sectors.
At a regional level, average female board representation in the Nordics is approximately 29 percent. Within the region, Norway reports the highest average at 38 percent, followed by Finland at 35 percent, Denmark at 30 percent, and Sweden at 23 percent. Sector-level data may show that companies in Benelux and DACH match or exceed Nordic performance in several industries.
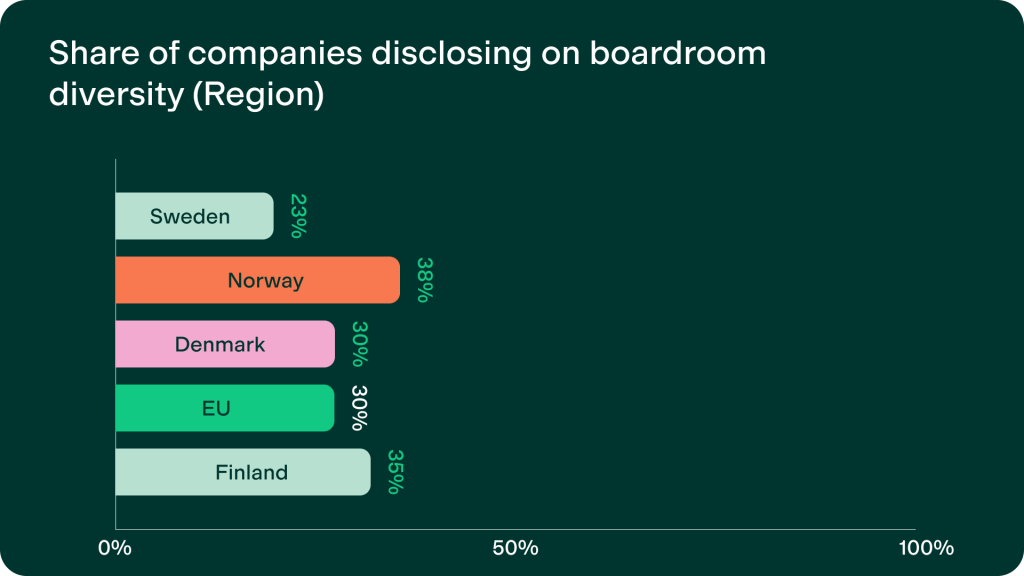
This remains an area of relative strength for the Nordics, but the data suggests that this advantage is neither uniform nor uncontested. Strong performance in certain countries and sectors coexists with weaker results elsewhere, while peer regions increasingly match or exceed Nordic averages. This points to governance diversity as an area where leadership must be actively maintained rather than assumed.
Where the nordics lag behind
Sustainability data availability
Data availability varies significantly by region. Companies in Benelux and the DACH region consistently report higher availability across a range of ESRS-relevant datapoints, including emissions, energy, workforce, and governance metrics. Data availability for DACH businesses stands currently at a high 78%, as just one example. Nordic companies report lower availability across most of these datapoints, particularly on workforce-related indicators. We’ll take a look at Scope-specific emissions shortly, but the core conclusion is that on ESRS-aligned data availability, Nordic companies report less consistently than peers in Benelux and DACH.
Workforce and injury reporting
Work-related injury reporting is one of the weakest areas for Nordic companies.
Only 23 percent of Nordic companies report work-related injury data. Reporting rates vary by country, with Finland at 47 percent, Sweden at 30 percent, Norway at 19 percent, and Denmark at 17 percent.
By comparison, a majority of companies in Benelux, DACH, and other EU countries report this datapoint, with 54% of Benelux companies doing so and 54% of DACH. The conclusion speculatively is that workforce safety reporting remains a clear gap for Nordic companies relative to other European regions and an important focus area for businesses that may have a stronger stake in it than most. For example, as we covered in our recent webinar on Food & Beverage benchmarks, we noted that industry-specific factors strongly influence what reporting of this kind looks like on a regional level.
In simple terms, the spread of businesses who have a vested interest in minimizing workforce injuries might inherently be lower in Sweden.
The gap in workforce and safety reporting highlights a shift in what sustainability leadership increasingly entails. As social disclosures move from voluntary narratives to mandatory, auditable datapoints, low reporting rates risk becoming a compliance and credibility issue rather than merely a transparency gap. Workforce indicators may therefore represent one of the most immediate areas where Nordic companies face heightened scrutiny.
Emissions intensity and value chain exposure
Emissions intensity varies substantially by sector across the dataset.
In most sectors, Scope 3 emissions account for the largest share of total emissions, reflecting the importance of upstream and downstream value chains. High renewable electricity consumption does not consistently correspond to lower total emissions intensity when Scope 3 emissions dominate.
That being said, this is a clear area where the Nordics are not leading. Despite 56% of companies in this region reporting on Scope 3 data, they are far behind Benelux, DACH, and other EU countries, with 77% of Benelux companies reporting on this data. The only region that lags behind the Nordics is the UK & Ireland, with 50% of companies there reporting their Scope 3 data.
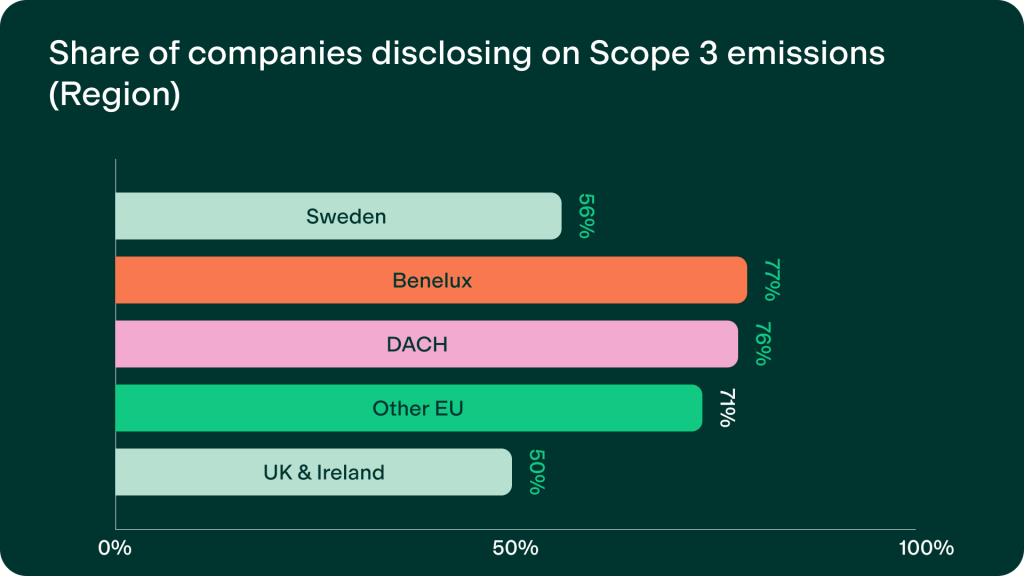
A nuance to flag here is that generally the companies sampled from outside of the Nordics were larger and thus are more likely to have access to their supplier and third-party data, a critical component in mapping all Scope 3 emissions.
However, the dominance of Scope 3 emissions across most regions reinforces the limits of operational decarbonization alone. High renewable electricity consumption does not automatically translate into lower emissions intensity when upstream and downstream activities drive overall impact. This demonstrates the importance of value-chain engagement and supplier data as central components of credible climate strategies going forward.
Are the Nordics still leading?
The data shows that Nordic companies perform strongly on certain indicators, particularly renewable electricity consumption and board gender diversity. The Nordics report a 45% consumption of renewable energy, compared to 37% in Benelux and 36% in DACH.
At the same time, companies in Benelux and DACH lead on data availability and workforce-related disclosures, which are increasingly critical in the context of CSRD and ESRS requirements. This could be yet another reflection of the nuanced differences within these regions, with DACH or Benelux disproportionately represented by businesses that require more visibility on things like workplace industries, but it could also demonstrate a shift in the compliance readiness between these other EU regions and the Nordics.
One could argue that this is a matter of prioritizing the lowest hanging fruits. According to Eurostat data, the share of energy from renewable sources in heating and cooling was more than 50% in Sweden (67.8%), Finland (62.6%) alone, with Denmark not far behind. As such, it could be argued that these regions are playing to their sustainability strengths, while DACH, with its share of larger companies, might simply be pursuing other more accessible areas of compliance more readily.
Conclusion: What this means for Nordic companies
The benchmark data highlights several areas where Nordic companies could improve alignment with evolving regulatory expectations.
These include increasing availability of ESRS-relevant data, improving workforce and safety reporting, strengthening value-chain coverage for Scope 3 emissions, and ensuring consistent, auditable disclosure processes.
As sustainability reporting becomes more standardized and comparable, performance will increasingly be judged on data completeness and consistency, not only on structural advantages. Specifically, the biggest strategic impacts that Nordics businesses could pursue are those that they lag behind in, in relation to their peers across the rest of Europe. Taking action on Scope 3 emissions as an example, as opposed to pursuing greater renewable energy consumption, will yield far more sustainability and compliance gains for these businesses, with the opposite being true for peers in DACH and Benelux.
So, leading? In some areas, absolutely. But the broader picture of sustainability and compliance is far more nuanced in 2026, and thus requires a far more strategic lens.
Strategy informed by benchmarks
As sustainable competitiveness increases, your sustainability performance should not be assessed in isolation.
Position Green’s Benchmarking solution enables companies to compare their sustainability performance and disclosure maturity against peers by region, sector, and company size, using the same indicators that underpin CSRD and ESRS reporting.
For organisations seeking to understand where they stand, where they lag behind peers, and which indicators matter most in their industry, benchmarking provides the context needed to prioritise action with confidence.
Explore the Benchmarking solution to see how your sustainability performance compares, based on real data rather than assumptions.
Start benchmarking