Top sustainability metrics in Food & Beverage

Benchmarking insights from Position Green, based on data from roughly 750 companies reporting under ESRS-aligned structures, combined with generally available sustainability statistics show clear patterns. Not neat answers, but signals strong enough to guide action. This article contains a specified selection of the data shared through our Sustainable business playbook.
Almost everything is material, and that’s the problem
If you operate in Food & Beverage, sustainability is embedded in your business whether you like it or not. From land use and water consumption to frontline labour and consumer trust, the sector touches nearly every sustainability topic.
The benchmark data reflects this breadth. Climate change mitigation, energy use, resource inflows and outflows, and working conditions are among the most frequently identified material topics across companies.
Food & Beverage consistently sits at the upper end of environmental materiality compared with other sectors, particularly on climate mitigation, water, biodiversity and pollution.
On the social side, Food & Beverage companies identify working conditions, equal treatment and consumer safety as material at higher rates than many other industries, reflecting reliance on frontline labour and direct consumer interaction.
What the data does not tell you is where to start. That decision has to be made deliberately, but it can be informed by a solid understanding of what your peers are doing themselves.
Materiality only becomes useful when it forces trade-offs
Most Food & Beverage companies already have a double materiality matrix. But not many will leverage it for its value as a strategic prioritization mechanism. When looking at it within this industry, it becomes readily apparent that there is a clear bias towards certain disclosures, as there should be. Each industry will have its own priorities for strategic action and Food & Beverage is no exception. So, review the following data with this in mind and as a counterpoint to the priorities you have within your organization.
Across the benchmark dataset, companies tend to identify impacts as material more often than financial risks or opportunities. Yet many topics still emerge as double material, meaning they are seen as relevant both operationally and financially.
This explains why sustainability strategies so easily become overloaded. If most topics are double material, prioritization cannot be implicit. It has to be explicit.
More mature companies use materiality to narrow focus, not expand it. They decide where leadership is essential, where staying competitive is enough, and where compliance alone is acceptable. Without those distinctions, strategies grow in scope and shrink in impact.
For Food & Beverage as an example, there is a strong investment in materiality in water usage and impacts on biodiversity loss, with the latter having well over 90% of companies mapping it as material, well above the second highest sector, Transportation, which sits at just 60%.
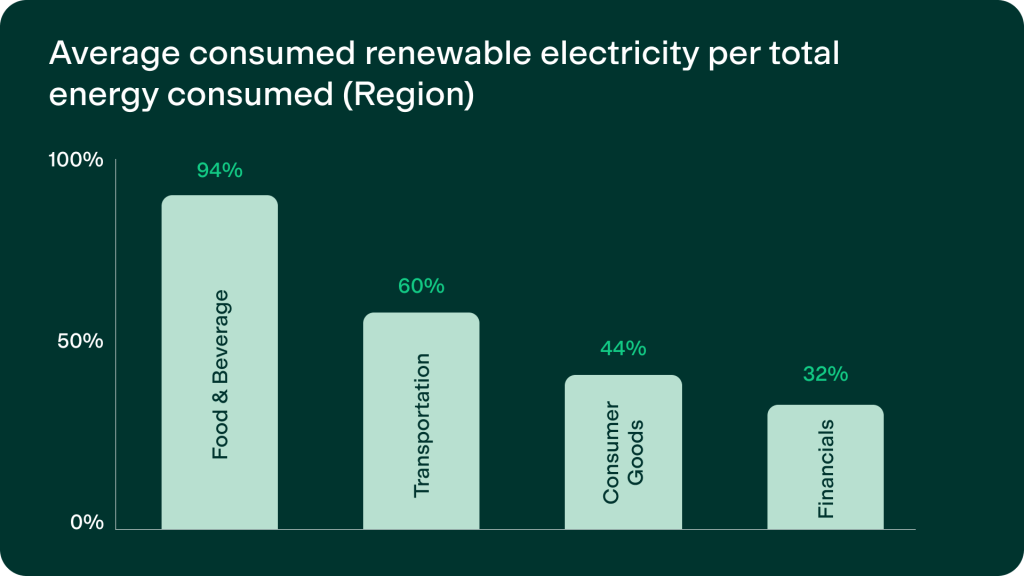
What this means for you is that focusing your efforts on other, less well-mapped areas of compliance could yield far more impact than simply following the trends of your peers. Conversely, if this is an area where you lag compared to your peers, it might be seen as a gap in your overall maturity in this material area. Consider what separates you from your peers in terms of capabilities in enacting certain material efforts. For example, if you have a stronger relationship with suppliers than usual, it might lend itself to a more ambitious biodiversity plan, where a peer with less sturdy relationships would struggle to make impact.
The bottom line, however, is that there is no perfect strategy to suit every business wholesale. Nor is it advisable to simply “hedge your bets” by covering as many compliance bases as possible. Instead, consider your materiality as a filtration tool, from which you can assess where and how you can have the most impact.
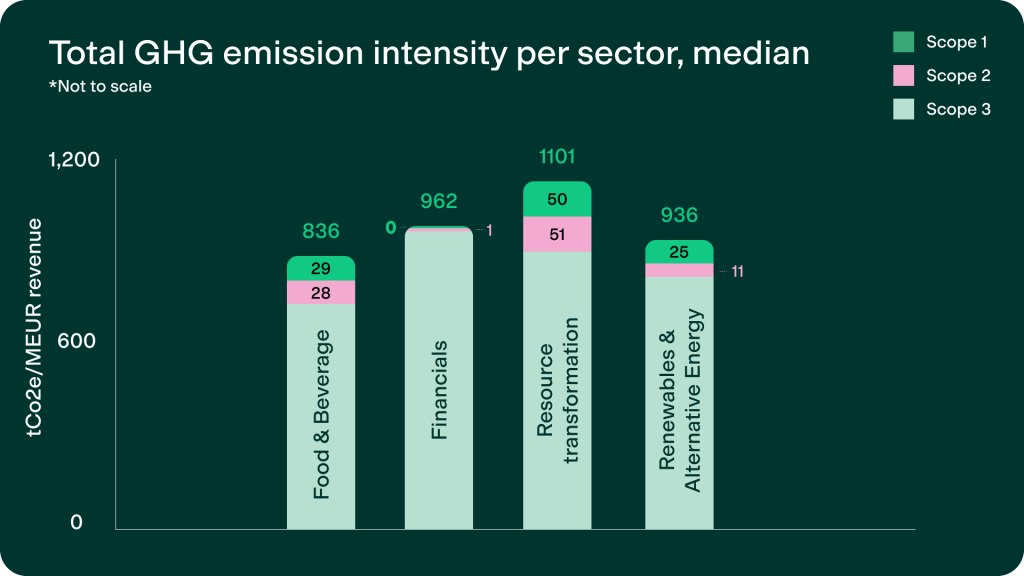
Scope 3 emissions dominate, but perfection is the wrong goal
More than 90% of Food & Beverage emissions sit in Scope 3. Median total emissions intensity for the sector is 836 tonnes of CO₂e per million EUR in revenue, placing it in the moderate-to-high intensity group compared with other sectors.
Agriculture, packaging and logistics account for most of this footprint. That is easy to understand given their dependence on transportation and factory operations. What is more revealing is how companies are attempting to measure it.
Benchmark data shows that Food & Beverage companies are almost evenly split between activity-based and spend-based methods for Scope 3 calculations, with supplier-specific data used by only a small minority.
The mistake many organizations make is treating Scope 3 primarily as a data problem. In practice, it is a supplier relationship problem.
The companies moving forward are not waiting for perfect numbers. They are identifying the suppliers that matter most, starting structured engagement, and improving data quality incrementally.
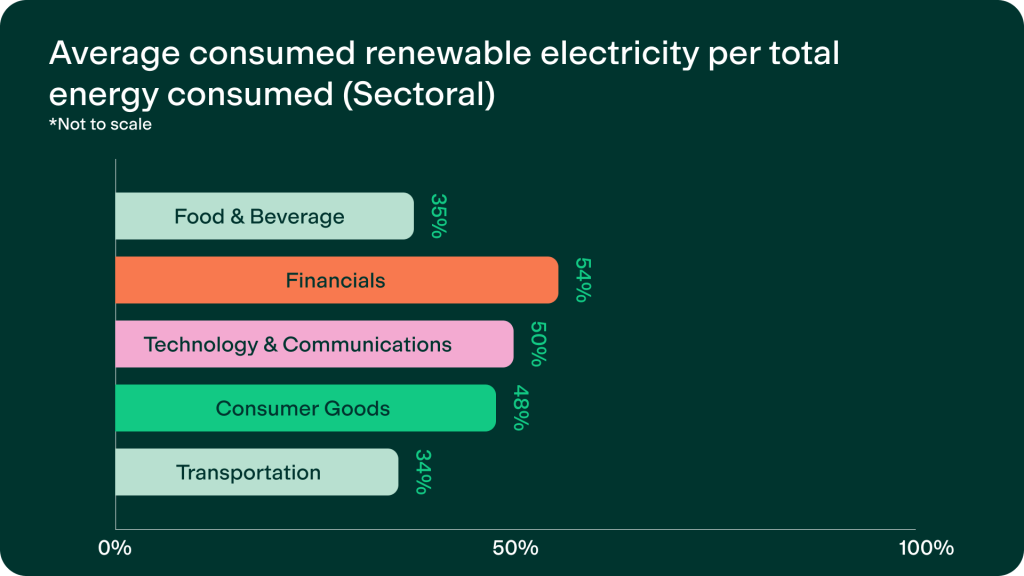
Renewable energy is one of the few areas where speed is still possible
For all the complexity of Scope 3, Scope 2 remains relatively straightforward and underused.
Food & Beverage companies report an average renewable electricity share of around 35%. This is below sectors such as Financials and Technology & Communications and signals clear room for improvement.
Scope 2 reporting also remains largely location-based. Only around 29% of Food & Beverage companies primarily use market-based methods, indicating limited uptake of contractual renewable instruments.
Production sites, warehouses and energy-intensive locations often offer predictable savings, lower exposure to volatility, and fast, credible emissions reductions. Not everything in sustainability delivers quick wins. This still can.
Safety shows up in the data, and in the balance sheet
Work-related injuries are reported at similar rates across sectors, but the impact in Food & Beverage is higher.
Only around 39% of Food & Beverage companies report injury data at all, yet the sector records one of the highest levels of lost-time injuries.
Median days lost due to work-related injuries stand at 0.237 days per employee, placing Food & Beverage among the highest-impact sectors.
This is not surprising given the physical nature of food processing and production. What is surprising is how often safety is treated as a peripheral social metric.
When companies connect safety data to productivity losses, operational disruption, and insurance and absenteeism costs, it stops competing for attention and starts commanding it.
Turnover is not inevitable
Employee turnover in Food & Beverage sits at 19.7%, well above the median across all companies and consistent with other labour-intensive, consumer-facing sectors.

At the same time, benchmark analysis shows a negative correlation between employee satisfaction and turnover. Companies with higher eNPS scores tend to show lower churn, although the relationship is weak and not causal.
This matters because churn is expensive. Companies that look beyond hiring numbers and track satisfaction alongside retention are better able to pinpoint root causes, prioritise interventions, and justify investment in working conditions and safety.
Retention is often one of the most financially efficient sustainability levers available, but generally underappreciated by businesses. One potential action that could be taken is to couple a retention strategy with improvements in working conditions and supply chain management. This alone could ensure that you not only reduce the churn present in your organization, but also mitigate potential risks that might otherwise cost you in the long run, such as workplace accidents, or exposure in your supply chains.
Governance works when it mirrors reality, not templates
Governance risks in Food & Beverage do not resemble those in finance-heavy sectors. Supplier relationship management and animal welfare are consistently identified as material governance topics, while issues such as lobbying or whistleblower protection are prioritised less frequently.
Board diversity data shows Food & Beverage averaging around 30% female representation, close to the cross-sector median but behind governance leaders such as Financials and Technology
Across the dataset, there is also a slight negative correlation between female C-suite representation and total GHG emission intensity, though this is not causal.
The practical takeaway is simple. Governance works best when it reflects operational reality and real risk exposure, not generic templates.
The real dividing line is how companies use their data
Ambition levels are surprisingly similar across Food & Beverage companies. What separates the more mature from the rest is how ESG data is used.
Fewer than half of all benchmarked datapoints are reported by a majority of companies, and data availability increases significantly with company size. Regionally, companies in DACH and Benelux consistently show higher data coverage than other markets.
Less mature organizations stop at disclosure. More mature ones use data to inform strategic priorities, shape investment decisions, build business cases, and assess the cost of inaction.
When sustainability data enters financial conversations, it stops being an obligation and starts influencing outcomes.
Heighten your impact with the right industry data
Having access to a concrete series of data-sets on exactly where your peers are leading or lagging is a gamechanger for your sustainable impact. It allows you to get a pulse check on where you can see not just nominal gains in your industry, but where compliance and sustainability are underserved in your sector.
Position Green comes equipped with exactly those capabilities, as the Benchmarking solution is purpose-built to help you determine where your sustainability progress sits in relation to your peers and your competitors. Coupled with the rest of the platform, it provides immediate insights into actions you can take today to further your impact, without spreading your strategy too thin.
Explore Benchmarking